
Fail:Sectoral Financial Balances in U.S. Economy.png

Algfail (1388 × 775 pikslit, faili suurus: 146 KB, MIME tüüp: image/png)
| See fail ja sellest kastist allapoole jääv kirjeldus pärinevad kesksest failivaramust Wikimedia Commons. | Faili lehekülg Commonsis |
Lühikirjeldus
| Kirjeldus |
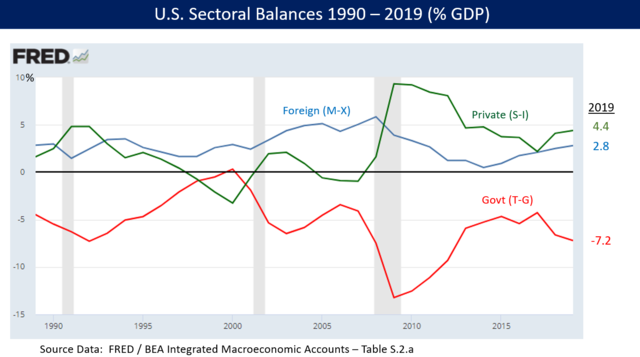
English: Sectoral Financial Balances in U.S. Economy 1990-2012 |
| Kuupäev | |
| Allikas | I created this file using Federal Reserve data (FRED Database) |
| Autor | Farcaster |

|
See pilt tuleks konverteerida kasutades vektorgraafikat (SVG-vorming). Vektorkujutisel on mitmeid eeliseid. Konverteerimise kohta vaata täpsemalt siit. Kui sellest pildist on vektorkujutis juba saadaval, siis pane selle malli asemele {{vector version available|uue pildi nimi.svg}}.
|
Other information:
Original upload date (on English Wikipedia): 2013-03-24
Based on article from Martin Wolf, cited below.
Understanding the chart
This chart is based on an article and graphic from economist Martin Wolf. Wolf explained in July 2012 that government fiscal balance is one of three major financial sectoral balances in the U.S. economy, the others being the foreign financial sector and the private financial sector. The sum of the surpluses or deficits across these three sectors must be zero by definition. The three data series are:
- Foreign sector financial balance: This is the capital account. A foreign financial surplus or capital account surplus exists because capital is imported (net) to fund the U.S. trade deficit. To finance imports greater than exports, capital must be imported by definition; this is called a surplus.
- Private sector financial balance: This is the difference between private savings (mostly by consumers) and private investment (mostly by businesses). One way to think about an economy is that consumers save and businesses take the savings and invest it. The two figures tend to move in tandem. However, if consumers are saving but businesses are not investing, a surplus develops. In the wake of the subprime mortgage crisis, savings increased but investment declined dramatically, moving this balance from deficit into surplus.
- Government sector financial balance: This is the difference between government revenues less spending. It would be the sum of federal, state and local budget surpluses or deficits.
By definition, with the first two in surplus there must therefore exist a government budget deficit so all three net to zero. For example, the government budget deficit in 2011 was approximately 10% GDP (8.6% GDP of which was federal), offsetting a capital surplus of 4% GDP and a private sector surplus of 6% GDP.[1][2] Wolf argued that the sudden shift in the private sector from deficit to surplus forced the government balance into deficit, writing: "The financial balance of the private sector shifted towards surplus by the almost unbelievable cumulative total of 11.2 per cent of gross domestic product between the third quarter of 2007 and the second quarter of 2009, which was when the financial deficit of US government (federal and state) reached its peak...No fiscal policy changes explain the collapse into massive fiscal deficit between 2007 and 2009, because there was none of any importance. The collapse is explained by the massive shift of the private sector from financial deficit into surplus or, in other words, from boom to bust."[3] Wolf also explained that if the government budget deficit had been forced to zero with the same capital surplus, the private sector income (and thus savings) would have fallen dramatically (likely a Depression) to bring that sector back into deficit, such that all three sectors would net to zero: "There is absolutely no doubt what would have happened if the government had been unwilling to borrow when borrowing by the private sector collapsed: we would have seen a huge depression. Fortunately, that did not happen. Government borrowed. Of course, that did not fully offset the collapse in private borrowing. But it helped."[4] An up-to-date version of the chart (directionally correct but not exactly) can be viewed here: FRED Database-Chart of Financial Sector Balances
As a formula
The above expressed as an equation or mathematical identity: C+G+T = 0.
- C: Private sector financial balance (+ for private sector surplus, where savings is greater than investment, - for private sector deficit, where savings is less than investment)
- G: Government sector financial balance (+ for budget surplus, - for budget deficit)
- T: Foreign sector financial balance (+ for capital surplus or trade deficit, - for capital deficit or trade surplus)
Note that if you define the foreign sector balance instead as the current account balance (i.e., trade deficit is a - and trade surplus is a +), the formula becomes C+G-T=0.[5]
The graphic can also be describing using the Keynesian equilibrium formula, where injections equals withdrawals:
- Investment + Government + Exports = Savings + Taxes + Imports
- I + G + X = S + T + M
Rearranging using algebra to show the data series in the graphic:
- (G-T) + (X-M) = (S-I)
- 0 = (S-I) + (T-G) - (X-M)
- S-I is the private sector balance, a positive amount as savings has exceeded investment since 2009.
- T-G is the government sector balance, a negative number as the government has run deficits from 2002-2015.
- X-M is the foreign sector, a negative number (trade deficit or capital surplus). Since the formula is subtracting this amount, we graph the inverse (*-1) so it appears as a positive number in the graph.
Note that this equation holds at economic equilibrium only, but is useful for illustrating the concepts.
Creating the chart
Via BEA (Exact)
The source data is the BEA Integrated Macroeconomic accounts[6], table S.2.a.[7]
- Private: Households (Row 39, 40) + Business (41, 42)
- Government: Federal (Row 43) + State and local (44)
- Foreign (Rest of the World): Row 45 (statistical discrepancy NIPA) and Row 46.
I used nominal GDP data from FRED for each year to make the GDP conversion, using the Q4 annualized number.
Table S.2.a "Selected Aggregates for Total Economy and Sectors" along with FA codes appears in this report, in Appendix B.[8][9]
The New Policy Institute published a 2011 paper that explains how the balances can be computed with a separation of private into households and business, along with a helpful graph and the FA codes used in the computation.[10]
Via FRED
- Three line annual: This FRED graph includes the foreign sector (blue), private (green) and government (red) via FRED. The statistical discrepancy is included with the rest of the world/foreign sector.[11]
- Three line quarterly.[12]
- Four line annual splits the private sector into household and business components.[13]
- Four line quarterly.[14]
Note that when these charts are downloaded, a horizontal sum of each time period should roughly net to zero.
Understanding the private sector financial balance

Economist Paul Krugman also explained in December 2011 the causes of the sizable shift from private sector deficit to surplus in the U.S.: "This huge move into surplus reflects the end of the housing bubble, a sharp rise in household saving, and a slump in business investment due to lack of customers."[15] The private sector financial balance is the net of the savings and investment lines shown in the "Private Sector Financial Surplus" chart at right. In other words, if you graphed the expression "Private savings - Business investment" as one line and as a % GDP, you would get in the blue line in the "Sectoral Financial Balances in the U.S. Economy" chart.
References
- ↑ Financial Times-Martin Wolf-The Balance Sheet Recession in the U.S.- July 2012
- ↑ Martin Wolf-Financial Times-We Still Have that Sinking Feeling-July 2012
- ↑ Financial Times-Martin Wolf-The Balance Sheet Recession in the U.S.- July 2012
- ↑ Financial Times-Martin Wolf-Debt, Deleveraging and Crisis in the U.S. - July 12, 2012
- ↑ QFinance-Anthony Harrington-Mauldin’s "Endgame" teaches politicians the basics, but are they listening-March 2011
- ↑ BEA-Integrated Macroeconomic Accounts for the United States-Retrieved June 23, 2018
- ↑ BEA Selected Aggregates for Total Economy and Sectors-Retrieved June 28, 2018
- ↑ The Integrated Macroeconomic Accounts for the United States-June 7, 2012
- ↑ BEA and FED-Integrated Macroeconomic Accounts for the U.S. - Draft SNA-USA-See Table 2-Retrieved June 23, 2018
- ↑ New Policy Institute-United States sector balances over five decades-July 29, 2011 archive copy at the Wayback Machine
- ↑ FRED-Sectoral Balances Three Line Annual-Retrieved September 7, 2020
- ↑ FRED-Sectoral Balances-Three line quarterly-September 11, 2018
- ↑ FRED-Sectoral Balances-Four Line Annual-September 11, 2018
- ↑ FRED-Sectoral Balances-Four Line Quarterly-September 11, 2018
- ↑ NYT-Paul Krugman-The Problem-December 2011
Litsents

|
Luba on antud selle dokumendi kopeerimiseks, avaldamiseks ja/või muutmiseks GNU Vaba Dokumentatsiooni Litsentsi versiooni 1.2 või hilisema Vaba Tarkvara Fondi avaldatud versiooni tingimuste alusel; muutumatute osadeta, esikaane tekstideta ja tagakaane tekstideta. Sellest loast on lisatud koopia leheküljel pealkirjaga "GNU Free Documentation License". |
- Tohid:
- jagada – teost kopeerida, levitada ja edastada
- kohandada – valmistada muudetud teoseid
- Järgmistel tingimustel:
- omistamine – Pead materjali sobival viisil autorile omistama, tooma ära litsentsi lingi ja märkima ära, kas on tehtud muudatusi. Sobib, kui teed seda mõistlikul viisil, kuid seejuures ei tohi jääda muljet, et litsentsiandja tõstab esile sind või seda, et sina materjali kasutad.
- sarnaselt jagamine – Kui töötled, kujundad ümber või arendad materjali edasi, siis pead oma töö levitamiseks kasutama sama litsentsi, mille all on algupärand, või ühilduvat litsentsi.
Esialgne üleslaadimislogi
Projektist en.wikipedia Commonsisse teisaldanud NUMB3RN7NE tööriistaga CommonsHelper.
| Kuupäev/kellaaeg | Mõõtmed | Kasutaja | Kommentaar |
|---|---|---|---|
| 05:25, 24 March 2013 | 960 × 720 (50,044 bytes) | w:en:Farcaster (arutelu | kaastöö) | Uploading a self-made file using [[Wikipedia:File_Upload_Wizard|File Upload Wizard]] |
Faili ajalugu
Klõpsa kuupäeva ja kellaaega, et näha sel ajahetkel kasutusel olnud failiversiooni.
| Kuupäev/kellaaeg | Pisipilt | Mõõtmed | Kasutaja | Kommentaar | |
|---|---|---|---|---|---|
| viimane | 8. september 2020, kell 07:39 | | 1388 × 775 (146 KB) | Farcaster | Update through 2019 |
| 29. juuni 2018, kell 07:02 |  | 1288 × 720 (59 KB) | Farcaster | Fix # | |
| 29. juuni 2018, kell 06:16 |  | 1303 × 724 (56 KB) | Farcaster | 2017 data | |
| 24. juuni 2018, kell 01:15 |  | 1386 × 784 (64 KB) | Farcaster | Upload with correct source data. | |
| 7. detsember 2015, kell 06:58 |  | 1371 × 782 (163 KB) | Farcaster | Reverted to version as of 23:06, 5 December 2015 (UTC) | |
| 7. detsember 2015, kell 06:58 |  | 1371 × 782 (163 KB) | Farcaster | Reverted to version as of 23:06, 5 December 2015 (UTC) | |
| 7. detsember 2015, kell 00:48 |  | 1371 × 782 (163 KB) | Farcaster | Reverted to version as of 23:05, 5 December 2015 (UTC) | |
| 6. detsember 2015, kell 02:06 |  | 1371 × 782 (163 KB) | Farcaster | Reverted to version as of 23:05, 5 December 2015 (UTC) | |
| 6. detsember 2015, kell 02:05 |  | 2520 × 1512 (257 KB) | Farcaster | Reverted to version as of 04:53, 5 December 2015 (UTC) | |
| 6. detsember 2015, kell 02:05 |  | 1371 × 782 (163 KB) | Farcaster | Updated chart |
Faili kasutus
Seda faili kasutab järgmine lehekülg:
Globaalne failikasutus
Järgmised muud vikid kasutavad seda faili:
- Faili kasutus vikis ar.wikipedia.org
- Faili kasutus vikis de.wikipedia.org
- Faili kasutus vikis en.wikipedia.org
- Government budget balance
- Austerity
- United States federal budget
- Subprime mortgage crisis
- Financial position of the United States
- Talk:Financial position of the United States
- Economic policy of the Barack Obama administration
- Wynne Godley
- Political debates about the United States federal budget
- Sectoral balances
- Secular stagnation
- Faili kasutus vikis es.wikipedia.org
- Faili kasutus vikis he.wikipedia.org
- Faili kasutus vikis ja.wikipedia.org
- Faili kasutus vikis lt.wikipedia.org
- Faili kasutus vikis ru.wikipedia.org
- Faili kasutus vikis tr.wikipedia.org