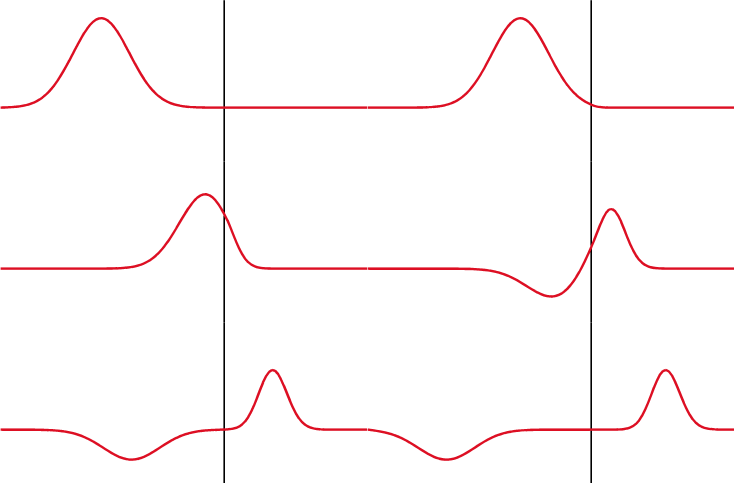
Fail:Partial transmittance.gif

Selle lehekülje sisule puudub teiste keelte tugi.
Klõps ikoonil viib faili leheküljele Wikimedia Commonsis.
Allikas: Vikipeedia

Partial_transmittance.gif(367 × 161 pikslit, faili suurus: 67 KB, MIME tüüp: image/gif, korduv, 53 kaadrit, 4,2 s)

Lühikirjeldus

Kirjeldus
Русский: Показано классическое отражение/прохождение солитона гауссового импульса от/в более плотную среду. В реальности же, свет отражается не от поверхности, а от всех частиц тела (см. ru:КЭД).
English: Illustration of partial reflection of a wave. A gaussian wave on a one-dimensional string strikes a boundary with transmission coefficient of 0.5. Half the wave is transmitted and half is reflected.
Français : Illustration de la réflection partielle d'une onde. Une onde gaussienne se déplaçant sur un ressort unidimensionnel est réfléchie/transmise au niveau d'une interface avec un coefficient de transmission de 0.5.
Español: Ilustración de una reflexión parcial de una onda. Una onda gaussiana sobre una cuerda de una dimensión choca contra un limite con un coeficiente de transmisión de 0.5. La mitad de la onda es transmitida y la otra mitad es reflejada.
Kuupäev
Allikas self-made with MATLAB, source code below
Autor Oleg Alexandrov
 
See GIF-rasterkujutis on valmistatud rakendusega MATLAB.

Litsents

Public domain Selle teose autoriõiguste valdajana annan selle teose avalikku omandisse. See kehtib üleilmselt.
Kui see pole mõnes riigis õiguslikult võimalik:
Annan kõigile õiguse seda teost kasutada ükskõik mille jaoks, ilma ühegi tingimuseta, kui seadus neid just ei sea.

MATLAB source code

% Partial transmittance and reflectance of a wave
% Code is messed up, don't have time to clean it now
function main()
 
   % KSmrq's colors
   red    = [0.867 0.06 0.14];
   blue   = [0, 129, 205]/256;
   green  = [0, 200,  70]/256;
   yellow = [254, 194,   0]/256;
   white = 0.99*[1, 1, 1];
   black = [0, 0, 0];
 
   % length of the string and the grid
   L = 5;
   N = 151;
   X=linspace(0, L, N);
 
   h = X(2)-X(1); % space grid size
   c = 0.01; % speed of the wave
   tau = 0.25*h/c; % time grid size
 
   % form a medium with a discontinuous wave speed
   C = 0*X+c;
 
   D=L/2;
   c_right = 0.5*c; % speed to the right of the disc
   for i=1:N
      if X(i) > D
         C(i) = c_right;
      end
   end
   % Now C = c for x < D, and C=c_right for x > D
 
   K = 5; % steepness of the bump
   S = 0; % shift the wave
   f=inline('exp(-K*(x-S).^2)', 'x', 'S', 'K'); % a gaussian as an initial wave
   df=inline('-2*K*(x-S).*exp(-K*(x-S).^2)', 'x', 'S', 'K'); % derivative of f
 
   % wave at time 0 and tau
   U0 = 0*f(X, S, K);
   U1 = U0 - 2*tau*c*df(X, S, K);
 
   U = 0*U0; % current U
 
   % plot between Start and End
   Start=130; End=500;
 
   % hack to capture the first period of the wave
   min_k = 2*N; k_old = min_k; turn_on = 0; 
 
   frame_no = 0;
   for j=1:End
 
      %  fixed end points
      U(1)=0; U(N)=0;
 
      % finite difference discretization in time
      for i=2:(N-1)
         U(i) = (C(i)*tau/h)^2*(U1(i+1)-2*U1(i)+U1(i-1)) + 2*U1(i) - U0(i);
      end
 
      % update info, for the next iteration
      U0 = U1; U1 = U;
 
      spacing=7;
 
     % plot the wave
      if rem(j, spacing) == 1 & j > Start
 
         figure(1); clf; hold on;
         axis equal; axis off; 
         lw = 3; % linewidth
 
         % size of the window
         ys = 1.2;
 
         low = -0.5*ys;
         high = ys;
         plot([D, D], [low, high], 'color', black, 'linewidth', 0.7*lw)
%         fill([X(1), D, D, X(1)], [low, low, high, high], [0.9, 1, 1], 'edgealpha', 0);
%         fill([D X(N), X(N), D],  [low, low, high, high], [1, 1, 1], 'edgealpha', 0);
 
         plot(X, U, 'color', red, 'linewidth', lw);
 
         % plot the ends of the string
         small_rad = 0.06;
 
         axis([-small_rad, 0.82*L, -ys, ys]);
 
         % small markers to keep the bounding box fixed when saving to eps
         plot(-small_rad, ys, '*', 'color', white);
         plot(L+small_rad, -ys, '*', 'color', white);
 
         pause(0.1)
         frame_no = frame_no + 1;
         %frame=sprintf('Frame%d.eps', 1000+frame_no); saveas(gcf, frame, 'psc2');
         frame=sprintf('Frame%d.png', 1000+frame_no);% saveas(gcf, frame);
         disp(frame)
         print (frame, '-dpng', '-r300');
 
      end
   end
 
 
% The gif image was creating with the command
% convert -antialias -loop 10000  -delay 8 -compress LZW -scale 20% Frame10*png Partial_transmittance.gif
% and was later cropped in Gimp

Pealdised

Lisa üherealine seletus sellest, mida fail esitab

Selles failis kujutatud üksused

kujutab

Faili ajalugu

Klõpsa kuupäeva ja kellaaega, et näha sel ajahetkel kasutusel olnud failiversiooni.

Kuupäev/kellaaegPisipiltMõõtmedKasutajaKommentaar
viimane9. aprill 2010, kell 19:36Pisipilt versioonist seisuga 9. aprill 2010, kell 19:36367 × 161 (67 KB)Aiyizooptimized animation
26. november 2007, kell 08:56Pisipilt versioonist seisuga 26. november 2007, kell 08:56367 × 161 (86 KB)Oleg Alexandrov{{Information |Description=Illustration of en:Transmission coefficient (optics) |Source=self-made with MATLAB, source code below |Date=~~~~~ |Author= Oleg Alexandrov |Permission=PD-self, see below |other_versions= }} {{PD-se

Seda faili kasutab järgmine lehekülg:

Globaalne failikasutus

Järgmised muud vikid kasutavad seda faili:

Vaata selle faili globaalset kasutust.