Fail:Halflife-sim.gif

Lehekülje sisu ei toetata teistes keeltes.
Klõps ikoonil viib faili leheküljele Wikimedia Commonsis.
Allikas: Vikipeedia

Halflife-sim.gif(100 × 188 pikslit, faili suurus: 17 KB, MIME tüüp: image/gif, korduv, 80 kaadrit, 8,5 s)

Lühikirjeldus

Kirjeldus
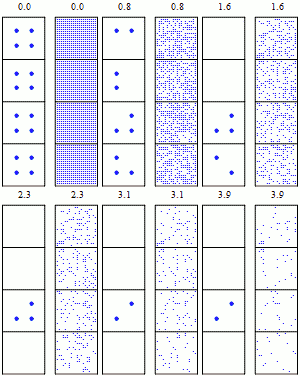
English: Simulation of many identical atoms undergoing radioactive decay, starting with either four atoms (left) or 400 atoms (right). The number at the top indicates how many half-lives have elapsed. Note the law of large numbers: With more atoms, the overall decay is less random. Image made with Mathematica, I am happy to send the source code if you would like to make this image more beautiful, or for any other reason.
Kuupäev
Allikas Üleslaadija oma töö
Autor Sbyrnes321

Litsents

Public domain Selle teose autoriõiguste valdajana annan selle teose avalikku omandisse. See kehtib üleilmselt.
Kui see pole mõnes riigis õiguslikult võimalik:
Annan kõigile õiguse seda teost kasutada ükskõik mille jaoks, ilma ühegi tingimuseta, kui seadus neid just ei sea.
(* Source code written in Mathematica 6.0, by Steve Byrnes, 2010. I release this code into the public domain. *)

SeedRandom[2]

(*Build list of point coordinates and radii*)

BuildCoordList[SqCenterX_, SqCenterY_, SqSide_, PtsPerRow_] := 
  Flatten[Table[{i, j}, {i, SqCenterX - SqSide/2, SqCenterX + SqSide/2, SqSide/(PtsPerRow - 1)},
     {j, SqCenterY - SqSide/2, SqCenterY + SqSide/2, SqSide/(PtsPerRow - 1)}], 1];

coordslist = Join[
   BuildCoordList[3.5, 1, 1.8, 20],
   BuildCoordList[3.5, 3, 1.8, 20],
   BuildCoordList[3.5, 5, 1.8, 20],
   BuildCoordList[3.5, 7, 1.8, 20],
   BuildCoordList[1, 1, .7, 2],
   BuildCoordList[1, 3, .7, 2],
   BuildCoordList[1, 5, .7, 2],
   BuildCoordList[1, 7, .7, 2]];
NumPts = Length[coordslist];
radiuslist = Join[Table[.03, {i, 1, 4*400}], Table[.1, {i, 1, 4*4}]];

(*Draw borders*)

xlist = {0, 2};
leftx = 0;
rightx = 2;
numx = Length[xlist];
ylist = {0, 2, 4, 6, 8};
topy = 0;
boty = 8;
numy = Length[ylist];
lines = {};
For[i = 1, i <= numy, i++, 
  lines = Append[lines, Line[{{leftx, ylist[[i]]}, {rightx, ylist[[i]]}}]]];
For[i = 1, i <= numx, i++, 
  lines = Append[lines, Line[{{xlist[[i]], topy}, {xlist[[i]], boty}}]]];

xlist = {2.5, 4.5};
leftx = 2.5;
rightx = 4.5;
numx = Length[xlist];
ylist = {0, 2, 4, 6, 8};
topy = 0;
boty = 8;
numy = Length[ylist];
For[i = 1, i <= numy, i++, 
  lines = Append[lines, Line[{{leftx, ylist[[i]]}, {rightx, ylist[[i]]}}]]];
For[i = 1, i <= numx, i++, 
  lines = Append[lines, Line[{{xlist[[i]], topy}, {xlist[[i]], boty}}]]];

(*Write numbers:
I want to be able to write a number with one decimal place,
including padding with ".0" when it's an integer.*)

WriteNum[num_] := Block[{rounded}, rounded = N[Floor[num, 0.1]];
    If[FractionalPart[rounded] == 0, ToString[rounded] <> "0", ToString[rounded]]];

(*Randomly choose decay times:
To get an expontial-decay-distributed random number, we pick a number uniformly between 0 and 1.
Take its negative log to get the time that it blows up, which is between 0 and infinity.
But divide by log 2 so that when the time = 1, there's 50% chance of decaying. *)

BlowTime = Table[-Log[RandomReal[]]/Log[2], {i, 1, NumPts}];

(*Draw graphics*)

GraphicsList = {};
NumFrames = 80;
TimePerFrame = .05;

Video = {};
For[frame = 1, frame <= NumFrames, frame++,
  CurrentTime = (frame - 1)*TimePerFrame;
  ImageGraphicsList = lines;
  ImageGraphicsList = 
   Append[ImageGraphicsList, Text[WriteNum[CurrentTime], {.8, 8.5}, {-1, 0}]];
  ImageGraphicsList = 
   Append[ImageGraphicsList, Text[WriteNum[CurrentTime], {3.3, 8.5}, {-1, 0}]];
  For[pt = 1, pt <= NumPts, pt++,
   If[CurrentTime < BlowTime[[pt]], 
    ImageGraphicsList =   Append[ImageGraphicsList, {Blue, Disk[coordslist[[pt]], radiuslist[[pt]]]}]]];
  Video = Append[Video, Graphics[ImageGraphicsList, ImageSize -> 100]];];

(*Pause at start*)
Video = Join[Table[Video[[1]], {i, 1, 5}], Video];

(*Export*)
Export["test.gif", Video, "DisplayDurations" -> {10}, "AnimationRepititions" -> Infinity ]

Pealdised

Lisa üherealine seletus sellest, mida fail esitab

Selles failis kujutatud üksused

kujutab

Faili ajalugu

Klõpsa kuupäeva ja kellaaega, et näha sel ajahetkel kasutusel olnud failiversiooni.

Kuupäev/kellaaegPisipiltMõõtmedKasutajaKommentaar
viimane25. märts 2010, kell 22:41Pisipilt versioonist seisuga 25. märts 2010, kell 22:41100 × 188 (17 KB)AiyizoOptimized animation, converted to 16 color mode
5. veebruar 2010, kell 09:35Pisipilt versioonist seisuga 5. veebruar 2010, kell 09:35100 × 188 (156 KB)Sbyrnes321Changed top-bottom split to left-right split, with space between; pause at start; 400 atoms in each crowded box instead of 296. (Thanks to Bdb484 for suggestions.)
29. jaanuar 2010, kell 03:26Pisipilt versioonist seisuga 29. jaanuar 2010, kell 03:2661 × 131 (75 KB)Sbyrnes321{{Information |Description={{en|1=Simulation of many identical atoms undergoing radioactive decay. The number at the top indicates how many half-lives have elapsed. Note that after one half-life there are not ''exactly'' one-half of the atoms remaining, o

Seda faili kasutab järgmine lehekülg:

Globaalne failikasutus

Järgmised muud vikid kasutavad seda faili: