
Fail:E12 values graph.svg

Selle SVG-faili PNG-vormingus eelvaate suurus: 575 × 420 pikslit. Teised eraldusvõimed: 320 × 234 pikslit | 640 × 467 pikslit | 1024 × 748 pikslit | 1280 × 935 pikslit | 2560 × 1870 pikslit.
Algfail (SVG-fail, algsuurus 575 × 420 pikslit, faili suurus: 4 KB)
| See fail ja sellest kastist allapoole jääv kirjeldus pärinevad kesksest failivaramust Wikimedia Commons. | Faili lehekülg Commonsis |
Lühikirjeldus
| Kirjeldus |
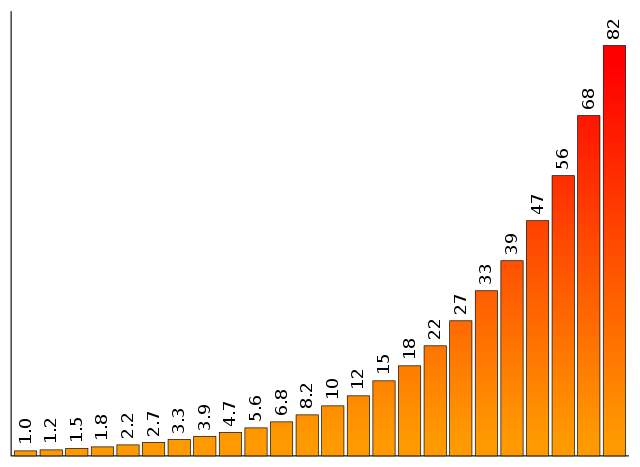
English: Graph showing values of the E12 series, which is used to standardize values of resistors and capacitors. The values shown cover two decades of the series, from 1 to 82, and illustrate the exponential nature of the series. |
| Kuupäev | |
| Allikas | Own work by uploader, designed to replace original bitmap image Image:E12_values_graph.png |
| Autor | Qef |
| Teised versioonid | Bitmap version showing the same data, but with superfluous labels, making it not language neutral: Image:E12_values_graph.png |
Litsents
| Autor Qef on andnud selle teose avalikku omandisse. See kehtib üleilmselt. Kui see pole mõnes riigis õiguslikult võimalik: |
Source code
This graph was generated by the Perl program below, which was specially written for the purpose. If changes need to be made, it's probably best to tweak the program and re-run it to get a new version, rather than editing the SVG directly.
use warnings;
use strict;

# The E12 series twice over, the first time divided by 10.
my @VALUES = qw(
    1.0 1.2 1.5 1.8 2.2 2.7 3.3 3.9 4.7 5.6 6.8 8.2
    10  12  15  18  22  27  33  39  47  56  68  82
);

# Parameters to set appearance.
my $AXIS_HT = 400;
my $VERT_SCALE = 4.5;
my $BAR_WIDTH = 20;
my $BAR_GAP = 3;
my $MARGIN = 10;

my $img_wd = ($BAR_WIDTH + $BAR_GAP) * @VALUES + $BAR_GAP + 2 * $MARGIN;
my $img_ht = $AXIS_HT + 2 * $MARGIN;
my $margin_right = $img_wd - $MARGIN;
my $margin_bottom = $img_ht - $MARGIN;

my $x = $MARGIN;
my $graph_path = '';
my $text_cmds = '';
for (@VALUES) {
    $x += $BAR_GAP;
    my $bar_ht = $_ * $VERT_SCALE;
    $graph_path .= "M$x,$margin_bottom v-$bar_ht h$BAR_WIDTH v$bar_ht Z\n";
    $x += $BAR_WIDTH;
    my $bar_top = $img_ht - $bar_ht - $MARGIN + -5;
    my $txt_x = $x - 0.5 * $BAR_WIDTH + 4.5;
    $text_cmds .= "  <text transform='translate($txt_x,$bar_top) rotate(270)'" .
                  " x='0' y='0' fill='#000' text-anchor='start'>$_</text>\n";
}

print <<"END";
<?xml version="1.0" encoding="UTF-8"?>
<svg version="1.0" width="$img_wd" height="$img_ht"
     xmlns="http://www.w3.org/2000/svg">

 <defs>
  <linearGradient id="grad" x2="0%" y1="0%" y2="100%">
   <stop offset="5%" stop-color="#F00" />
   <stop offset="95%" stop-color="#F90" />
  </linearGradient>
 </defs>

 <path stroke="#000" stroke-width="1" fill="none"
       d="M$MARGIN,$MARGIN V$margin_bottom H$margin_right"/>
 <path stroke="#000" stroke-width="0.6" fill="url(#grad)" d="$graph_path"/>
 <path stroke="#333" stroke-width="0.6" fill="url(#grad)" d="$graph_path">
 </g>
</svg>
END
Faili ajalugu
Klõpsa kuupäeva ja kellaaega, et näha sel ajahetkel kasutusel olnud failiversiooni.
| Kuupäev/kellaaeg | Pisipilt | Mõõtmed | Kasutaja | Kommentaar | |
|---|---|---|---|---|---|
| viimane | 3. juuli 2008, kell 20:07 | | 575 × 420 (4 KB) | Qef | {{Information |Description={{en|1=Graph showing values of the E12 series, which is used to standardize values of resistors and capacitors. The values shown cover two decades of the series, from 1 to 82, and illustrates the exponential nature of the serie |
Faili kasutus
Seda faili kasutab järgmine lehekülg:
Globaalne failikasutus
Järgmised muud vikid kasutavad seda faili:
- Faili kasutus vikis bg.wikipedia.org
- Faili kasutus vikis da.wikipedia.org
- Faili kasutus vikis de.wikipedia.org
- Faili kasutus vikis en.wikipedia.org
- User:Augur
- User:VinceyB
- User:Simen 88
- User:NekrosKoma
- User:Masterhomer
- Wikipedia:Userboxes/Philosophy
- User:MaesterTonberry
- User:Java7837/userboxing/Singularitarian
- User:Saukkomies/My userboxes
- User:Vaerinn
- User:Keskival
- User:Test35965
- User:Elsa-and-Anya
- User:ImmortalRationalist
- User:KiefKief
- User:AnnonJung
- User:Thablaqkgoat
- User:FrederickII
- E series of preferred numbers
- User:AllanVolt
- User:Just an ordinary human
- User:HeyTomek
- User:Berkay123456789
- Faili kasutus vikis en.wikiversity.org
- Faili kasutus vikis eo.wikipedia.org
- Faili kasutus vikis he.wikipedia.org
- Faili kasutus vikis uk.wikipedia.org
- Faili kasutus vikis zh.wikipedia.org